
Every compensation team eventually faces the same question from a CFO or a hiring manager: are we paying this person correctly? A compensation analysis is how you answer it with evidence instead of instinct, and how you defend the answer six months later when someone asks again.
This guide walks through the full process: what a compensation analysis is, the six steps it runs through, the data sources you can choose between, the metrics that carry a pay decision, and the mistakes that quietly invalidate the result. It is written for HR leaders, compensation analysts and finance partners who need the analysis to hold up under scrutiny.
| DEFINITION COMPENSATION ANALYSIS A compensation analysis is the structured comparison of what your organization pays for a defined set of roles against current external market data, and against itself internally, to determine whether pay is competitive, equitable and consistent with your compensation philosophy. It produces a decision, not a report: adjust, hold, or investigate further. |
What you will find in this guide
- What a compensation analysis is, and what it is not
- Why market movement makes a stale benchmark actively dangerous
- The six-step workflow, start to finish
- How to choose between verified payroll, survey and crowd-sourced data
- The four metrics that carry a pay decision
- Nine mistakes that invalidate an otherwise sound analysis
- How often to re-run the analysis, and what triggers an off-cycle review
- How LaborIQ supports compensation analysis
- Frequently asked questions
What is a compensation analysis?
A compensation analysis compares three things at once. It compares your pay to the external market, it compares your employees to each other, and it compares both to the pay philosophy you committed to. Drop any one of those and the analysis stops being able to answer the question it was built for.
The external comparison tells you whether you can hire and keep people. The internal comparison tells you whether the pay you already deliver is defensible across levels, functions and demographic groups. The philosophy comparison tells you whether the gaps you find are problems at all, because a company that deliberately targets the 40th percentile for administrative roles has not made a mistake when it lands there.
What it is not
| Often confused with | How it differs |
| Salary benchmarking | Benchmarking is the market-facing step inside a compensation analysis. The analysis adds internal equity, philosophy alignment and a remediation decision. |
| Pay equity audit | A pay equity audit asks whether pay differences between groups are explained by legitimate factors. It is a narrower, legally sensitive subset of the same data work. |
| Compensation planning | Planning allocates a budget across a cycle. The analysis tells planning where the money needs to go. |
| Salary survey participation | Submitting to a survey generates data. It does not interpret it, and survey cuts alone rarely match your actual job scope. |
| KEY TAKEAWAY A compensation analysis that only looks outward produces competitive pay with internal inequities. One that only looks inward produces internally consistent pay that loses every offer. You need both comparisons in the same exercise, run against the same job data. |
Why this matters more in 2026 than it did in 2019
The argument for running a compensation analysis on a schedule is not philosophical. It is arithmetic. Wage growth in the U.S. moved through a full cycle in five years, and a benchmark set at any point in that cycle was wrong within a few quarters.
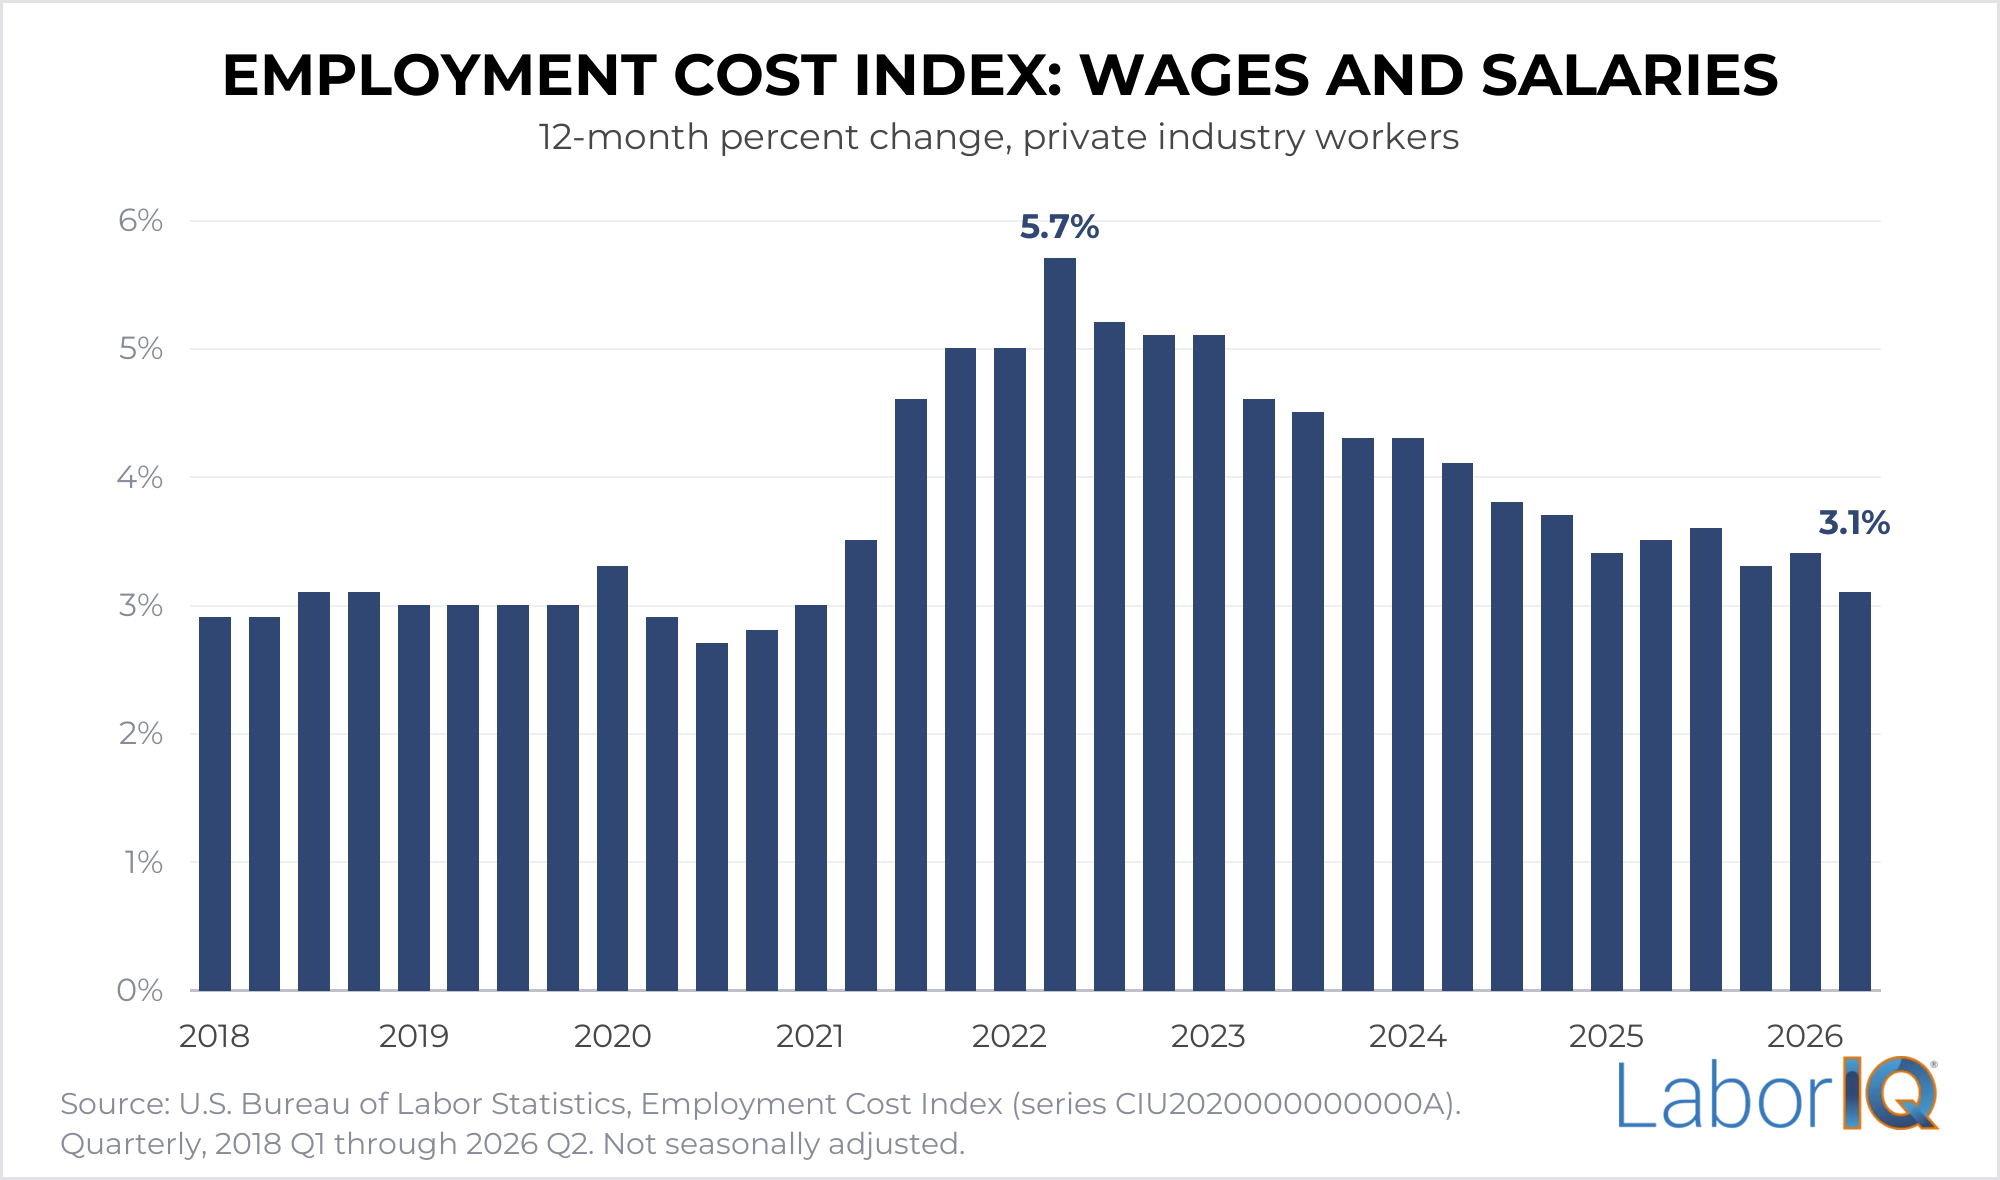
Between 2018 and 2020, employment costs for wages and salaries in private industry moved in a narrow band of 2.7% to 3.3% year over year. That stability is what made annual benchmarking defensible for a long time. Then the band broke. Wage growth reached 5.7% in the second quarter of 2022, fell back to 3.4% by the first quarter of 2025, and has since held inside a narrow 3.1% to 3.6% band.
| KEY STAT Wage growth peaked at 5.7% in 2022 Q2 and stood at 3.1% in 2026 Q2, a 2.6 point swing in four years. A range that was competitive at the peak is now priced for a market that no longer exists. Source: U.S. Bureau of Labor Statistics, Employment Cost Index. |
Two things follow from that chart. The first is that the direction of drift matters as much as its size. Ranges built during the surge are now generous, ranges built before it are now thin, and most organizations are carrying both at the same time in different job families. The second is that a single annual refresh cannot catch a market that moves this much between refreshes.
The six-step workflow
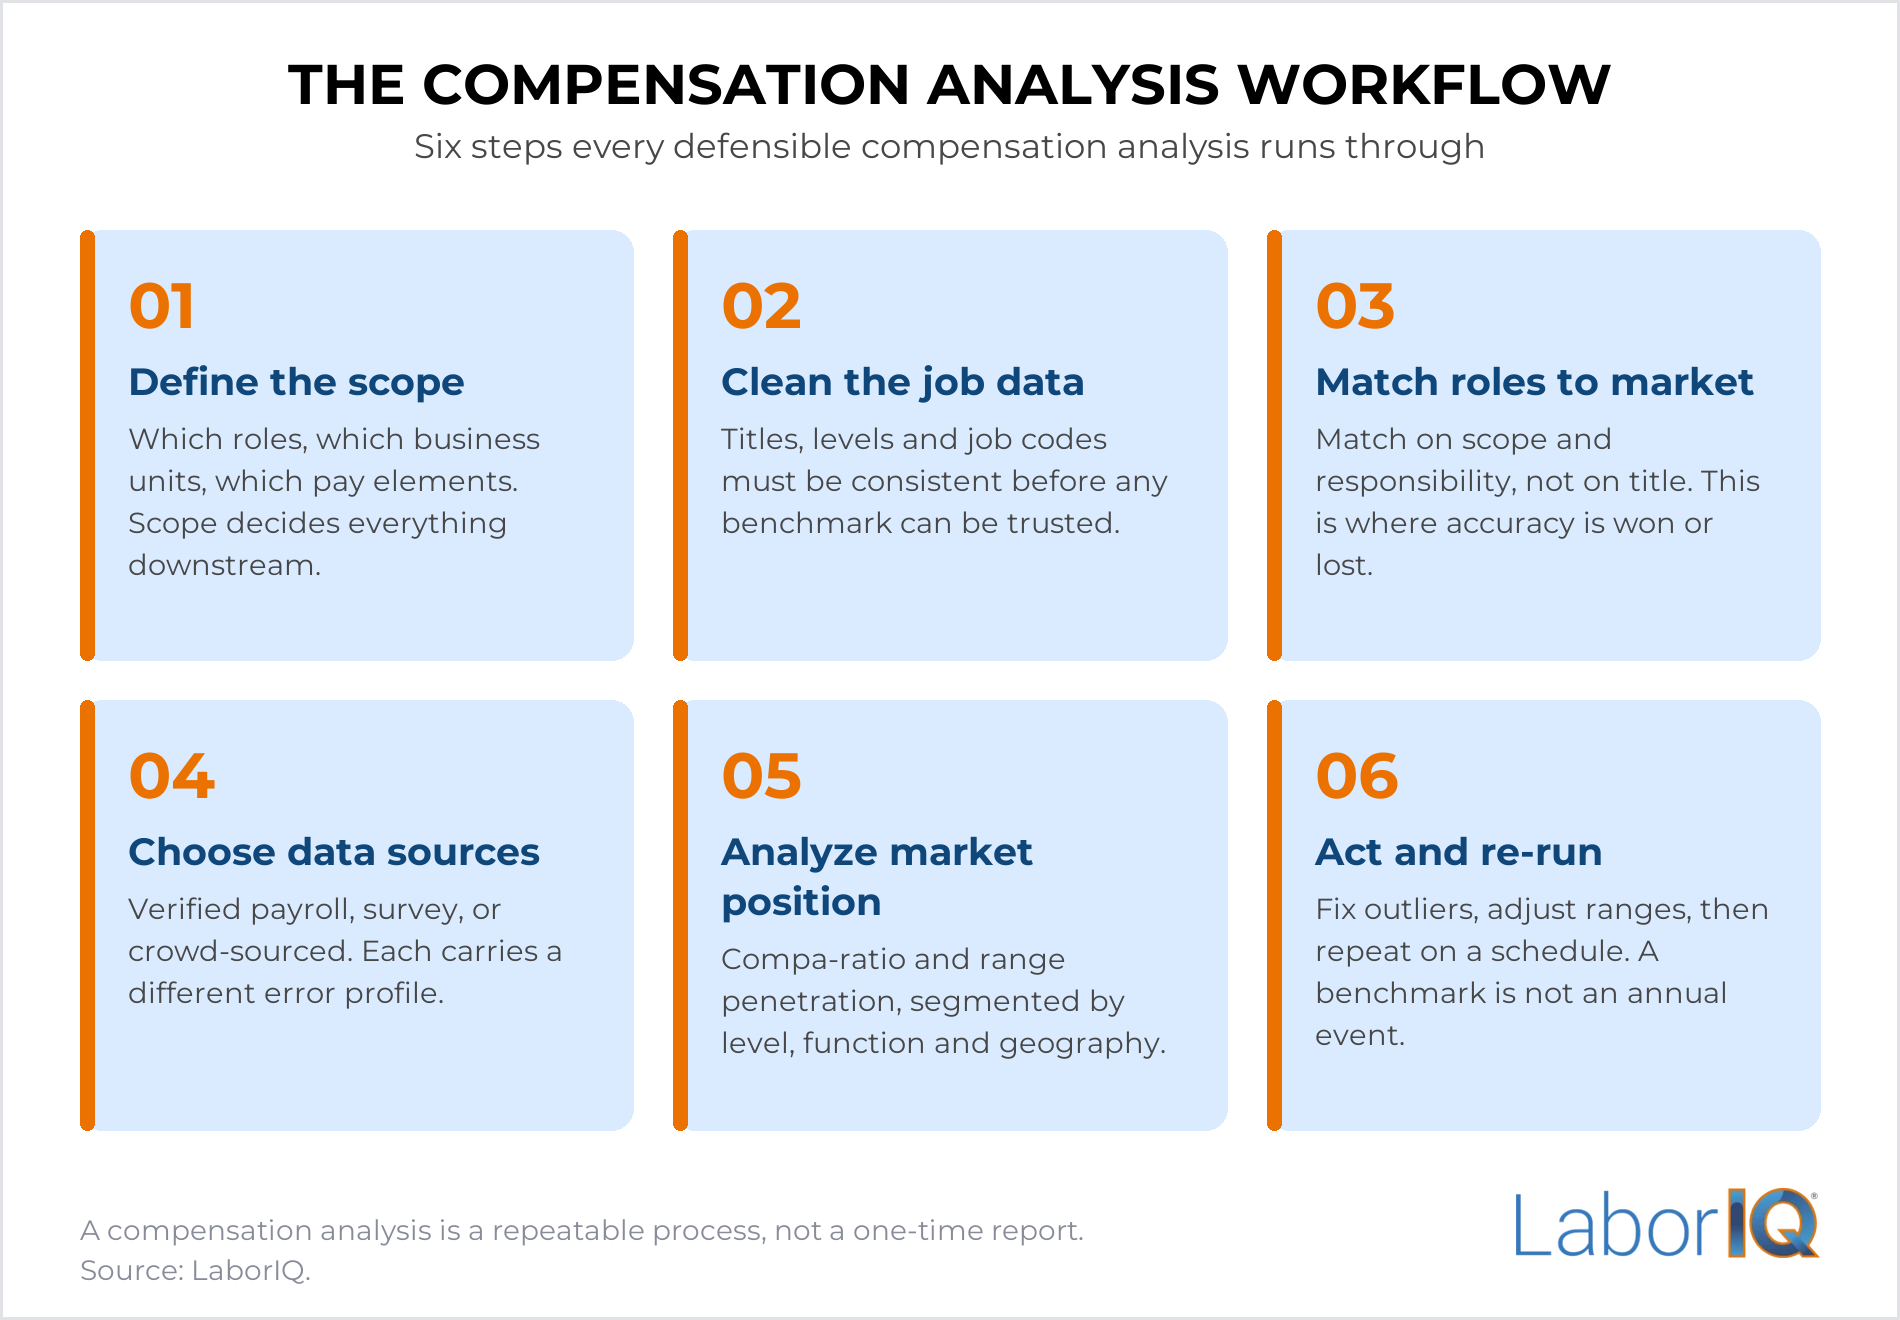
Every defensible compensation analysis runs through the same six steps in the same order. Skipping one does not save time; it moves the cost to the end, where you find out the results cannot be trusted.
Step 1: Define the scope
Scope decides everything downstream: how long the analysis takes, which data you need, and what you are able to conclude. Settle it before you pull a single number.
| Scope decision | What to settle |
| Population | All employees, one function, or a set of critical roles. Start narrow if this is your first analysis. |
| Pay elements | Base only, base plus target bonus, or total cash. Market data is not interchangeable between them. |
| Labor market | Local, regional, national, or remote-first. High cost-of-labor metros need geo-specific data. |
| Comparator set | Your industry, adjacent industries, or anyone competing for the same skill. Engineers are rarely an industry-only market. |
| Effective date | The date your market data is aged to. Every number in the analysis must share it. |
Step 2: Clean the job data
This is the least glamorous step and the one that most often decides whether the analysis is usable. Titles drift, levels get invented to justify raises, and the same job appears three times under three names. None of that is visible in the output. It quietly widens every range you produce.
| DATA WARNING If your organization carries more than one unique job title for every five employees, the title structure is almost certainly too fragmented for reliable benchmarking. Consolidate before you match. Role consolidation is typically the longest phase of a first analysis, so plan for it rather than discovering it. |
Step 3: Match roles to market
Matching is where the analysis is won or lost. You are looking for the market job whose scope, level and responsibility match yours, not the one whose title matches yours. A “Marketing Manager” who owns a $40M budget and eleven people is not the same market job as a “Marketing Manager” who runs the newsletter, and paying them from the same benchmark guarantees one of them is wrong.
| CRITICAL DISTINCTION Matching upward to a higher-scope survey job to justify a higher range is the most common manipulation in compensation work. It produces ranges that look market-competitive and are in fact above market for the role as performed. Assign a named reviewer who approves matches for critical roles, and keep a written rationale for each one. |
Step 4: Choose your data sources
All compensation data is an estimate of the same underlying thing. What separates sources is the error each one carries, and whether that error moves with the market or against it. The tradeoffs between verified and crowd-sourced compensation data are worth understanding before you commit.
| Source type | Strength | Error profile |
| Verified payroll data | Reflects pay as it was delivered, and refreshes as payroll refreshes. | Coverage depends on the provider’s payroll footprint for that role and market. |
| Traditional salary survey | Deep job-scope definitions and strong participation in mature industries. | Effective-dated and then aged forward. In a moving market the aging factor becomes the answer. |
| Crowd-sourced data | Broad, fast, and free. | Self-reported and unverified. Skews toward roles and markets where people are motivated to report. |
| Job postings | Shows what employers advertise right now, including posted ranges. | Advertised is not paid. Posted ranges are wide by design and often compliance-driven. |
Step 5: Analyze market position
With clean matches and a chosen source, position becomes measurable. Run it at three levels, the individual, the job and the segment, because a company can sit at the market median in aggregate while carrying serious problems inside individual functions.
Step 6: Act, then re-run
An analysis that ends in a slide deck has not finished. Decide what changes now, what changes at the next cycle, and what is accepted as a deliberate position. Document that third category. Unexplained gaps left alone without a written rationale are the ones that become a problem later.
The four metrics that carry a pay decision
| Metric | How to read it |
| Compa-ratio | Salary divided by range midpoint. 1.00 means paid at midpoint. Below 0.80 or above 1.20 warrants an explanation, not an adjustment by reflex. |
| Range penetration | Where the salary sits between range minimum and maximum, as a percentage. More honest than compa-ratio for wide ranges. |
| Market index | Salary divided by the market rate at your target percentile. Answers the external question directly. |
| Quartile distribution | How your population spreads across the range. A team clustered in Q1 has a retention problem forming; one clustered in Q4 has a promotion problem forming. |
Segment every one of these by level, function, tenure and geography before you draw a conclusion. An aggregate compa-ratio of 0.98 is reassuring and frequently hides a function sitting at 0.86.
Common mistakes in compensation analysis
| Mistake | Why it invalidates the result |
| Matching on title | Titles are internal artifacts. Two identical titles can be two different market jobs. |
| Mixing effective dates | Comparing data aged to different dates builds the aging error straight into the conclusion. |
| Comparing base to total cash | A silent apples-to-oranges error that usually reads as “we are behind the market.” |
| Using one source for everything | Every source has thin coverage somewhere. Know where yours is thin before you rely on it there. |
| Ignoring geography for remote roles | A remote-first population needs a stated geographic strategy before it can be benchmarked at all. |
| Treating prior salary as a pay factor | More than 20 states and localities have enacted salary history bans. It also replicates historical inequity forward. |
| Analyzing aggregates only | Segment-level problems disappear into a healthy company-wide average. |
| Stopping at the finding | An analysis without a remediation decision and an owner changes nothing. |
| Running it once | The market moved 2.6 points in four years. A one-time analysis has a short shelf life. |
| COMMON FAILURE MODE Teams invest months in a rigorous analysis, publish clean ranges, and then allow managers to make offers outside them without an approval path. The structure erodes within two cycles and the next analysis starts from the same fragmented baseline. Governance is not the follow-up to the analysis; it is part of it. |
How often should you re-run it
Treat the full analysis as annual, market data as continuous, and specific triggers as reasons to look early.
- Annually. The full scope, timed to land before compensation planning opens, not after.
- Quarterly. Critical and hard-to-fill roles, where a two-quarter drift is the difference between filling a req and losing it.
- On trigger. A new pay transparency obligation, entry into a new metro, an acquisition, a spike in regrettable attrition inside one function, or a role you have failed to fill twice.
| KEY TAKEAWAY The organizations that stay calibrated are not the ones that run the deepest annual analysis. They are the ones that keep market data flowing into every offer, promotion and range decision in between. |
How LaborIQ supports compensation analysis
LaborIQ provides the market layer of the analysis: current salary benchmarks for over 20,000 unique job titles across U.S. markets, built from 18 trillion data points and validated against 8.6 million real company pay stubs, with coverage spanning 1,600 industries.
| LABORIQ PLATFORM Compensation Intelligence Built for HR Leaders ✓ Salary benchmarks at the 25th, 50th, 75th and 90th percentiles for every U.S. role ✓ Role matching across thousands of job families and levels ✓ Geographic pay differential analysis for remote and multi-location teams ✓ Compa-ratio and range penetration reporting by level, function and demographic group ✓ Band design and market positioning scenario modeling → Request a Free Demo at laboriq.co/request-demo |
| Analysis step | How LaborIQ helps |
| Match roles to market | Job family and level matching across thousands of benchmark roles, so the match reflects scope rather than title. |
| Choose data sources | Benchmarks validated against actual payroll records rather than self-reported figures. |
| Analyze market position | Salary Answers returns percentile placement, compa-ratio and geographic differentials in one view. |
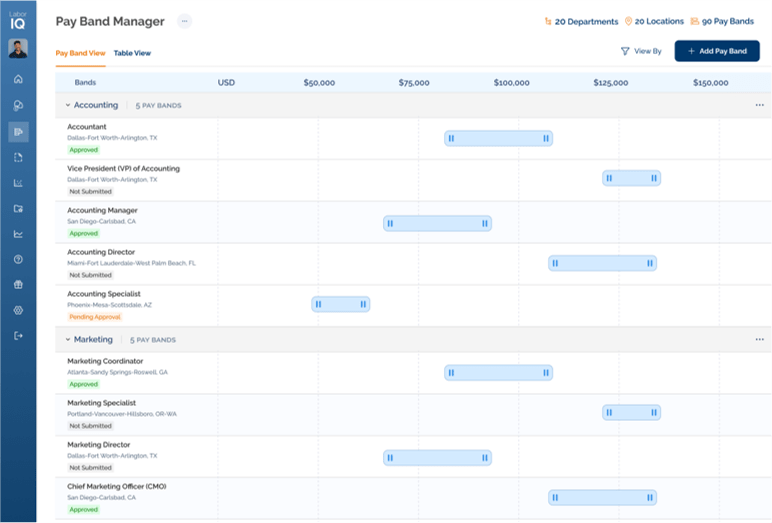
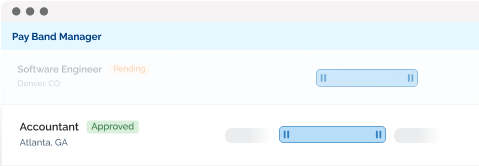
| Act and re-run | Pay Band Manager models range adjustments and remediation budgets before the number is committed. |
Frequently asked questions
How long does a compensation analysis take?
The timeline depends almost entirely on the state of your job data. Cleaning titles and matching roles usually takes longer than the analysis itself. Once the job architecture is stable, later runs are substantially faster than the first one.
What is the difference between a compensation analysis and salary benchmarking?
Benchmarking answers what the market pays for a job. A compensation analysis takes that answer, compares it to what you pay today, checks internal consistency across your population, tests both against your pay philosophy, and ends in a decision.
What market percentile should we target?
There is no universal answer, and a single target across the whole organization is usually the wrong one. The target should follow from your compensation philosophy and can differ by job family, with roles that are hard to fill or directly tied to revenue justifying a higher position than the rest of the organization. What matters is that the target is written down before the analysis runs.
How do we analyze compensation for fully remote employees?
Decide the geographic strategy first: pay by employee location, by a national rate, or by tiered zones. Each is defensible and each produces a different analysis. What is not defensible is discovering after the fact that different managers applied different strategies.
Can we run a compensation analysis with publicly available data?
You can produce a directional read from public sources, and for a very small organization that may be enough to spot an obvious outlier. It is generally not sufficient to support pay adjustments, because public data rarely matches your job scope and carries no verification against pay as it was delivered.
Do we have to share the results with employees?
You are generally not required to publish the analysis itself, though pay transparency law in a growing number of states governs what you must disclose about ranges. Most organizations share the framework, meaning how ranges are built and what percentile they target, without releasing individual findings.
How often does compensation market data change?
Continuously. Wage growth for private industry moved from 2.9% to 5.7% and back to 3.1% between 2018 and 2026, and individual job families move faster than the aggregate. That is why refresh cadence matters more than analysis depth.