Table of Contents
By LaborIQ Editorial Team | Compensation Strategy & Market Intelligence | Last updated April 2025
1. What Is Compensation Benchmarking, and Why Does It Matter?
| DEFINITION COMPENSATION BENCHMARKING Compensation benchmarking is the process of comparing an organization’s pay levels for specific roles against external market data to determine whether compensation is competitive, equitable, and aligned with the organization’s pay philosophy. It answers the foundational question every HR and finance leader faces: are we paying people what the market actually pays for this work? |
Pay is the single largest controllable cost in most organizations. It is also the single most powerful lever for talent attraction and retention. Despite this, a significant share of compensation decisions are still made without rigorous market data, relying instead on anecdote, recruiter feedback, or salary surveys that are 12 to 18 months out of date by the time they are published.
The consequences of underbenchmarking are well documented. Roles that drift below the 25th market percentile see measurably higher voluntary attrition. Roles that are overbenchmarked (paid significantly above market without a strategic rationale) create unsustainable cost structures and compression for colleagues who were hired at different market conditions. Both problems are preventable with a rigorous benchmarking process.
| KEY TAKEAWAY Compensation benchmarking is not a one-time salary survey exercise. It is a structured, repeatable process for keeping pay levels calibrated to a market that moves continuously. Organizations that treat benchmarking as an annual event consistently fall behind those that embed market data into every major compensation decision. |
Why Organizations Invest in Compensation Benchmarking (% citing as a primary driver)
| Driver | % Organizations |
| Reducing voluntary attrition in key roles | 79% |
| Maintaining competitive offers | 74% |
| Pay equity compliance | 67% |
| Budget discipline and cost management | 61% |
| Pay transparency law readiness | 56% |
Source: Radford Global Compensation Survey
2. How to Prepare for Benchmarking
Before pulling a single data point, organizations need clarity on four foundational questions that will shape every subsequent decision in the benchmarking process.
Define who owns benchmarking
Benchmarking without a clear owner produces inconsistent results and erodes confidence in the data. Assign ownership to Total Rewards or a senior HR Business Partner with explicit authority over the methodology, data sources, and update cadence. In the absence of dedicated Total Rewards staff, an external compensation consultant can own the methodology while an internal HR leader manages execution.
Establish a compensation philosophy first
Benchmarking without a compensation philosophy is navigation without a destination. Your philosophy should answer: What percentile do we target for base salary? How does that target vary by role criticality or talent market competitiveness? What is our total compensation mix (base, bonus, equity, benefits)? Without these anchors, benchmarking data produces ranges but no guidance on where to price within them.
Align on your relevant labor market
Pay varies significantly by geography, industry, and company size. A software engineer at a 50-person fintech startup in San Francisco commands a different market rate than the same role at a 5,000-person manufacturing company in Des Moines. Defining your relevant labor market before collecting data determines which benchmarks are actually comparable to your organization.
| Market Dimension | What to Decide |
| Geography | Local, regional, national, or remote-first? High cost-of-labor metros require geo-specific data |
| Industry | Are you competing for talent within your industry or across industries? |
| Company size | Revenue or headcount tiers affect pay levels significantly, particularly for leadership roles |
| Stage | Pre-IPO, public, or private equity-backed? Equity structures affect total comp significantly |
3. Step 1: Define Your Benchmarking Philosophy
A benchmarking philosophy is the set of principles that govern how you use market data to set pay. It must be specific enough to produce consistent decisions and transparent enough that managers and employees can understand the rationale for their pay levels.
Target percentile decisions
Most organizations choose a target percentile for base salary and a separate target for total cash compensation. Common market positions include:
| Market Position | Typical Rationale |
| 25th percentile | Cost discipline; typically paired with other non-cash differentiators (mission, flexibility, growth) |
| 50th percentile (median) | Meets market; appropriate for stable roles in non-hyper-competitive talent segments |
| 65th-75th percentile | Above market; used to attract or retain in competitive talent markets or for critical roles |
| 90th percentile | Aggressive talent acquisition; sustainable only for highest-impact or hardest-to-fill roles |
| IMPORTANT A single target percentile applied uniformly across all roles is a blunt instrument. Most mature organizations differentiate by role criticality: market-rate for most roles, above-market for revenue-generating and mission-critical positions, and maximum-competitive for the small set of roles where losing talent creates existential risk. Segment your philosophy before you benchmark. |
Define your compensation mix
Benchmarking base salary in isolation produces an incomplete picture for any role where variable pay, equity, or benefits represent a significant portion of total value. Define upfront whether you are benchmarking base only, total cash (base + target bonus), or total compensation (total cash + equity + benefits). The answer determines which data cuts you will need and how you will communicate pay decisions to employees.
4. Step 2: Select and Evaluate Market Data Sources
The quality of your benchmarking output is entirely dependent on the quality of your market data inputs. Not all compensation data sources are created equal.
Evaluating data sources
| Source Type | Strengths | Limitations |
| Annual compensation surveys (Radford, Mercer, Willis Towers Watson) | Deep sample sizes; well-established methodology; covers all levels | 12-18 month data lag; expensive; matching is manual and time-consuming |
| Real-time benchmarking platforms (LaborIQ, Levels.fyi for tech) | Current data; role-specific granularity; faster to access | Sample size varies by role and market; requires platform investment |
| Government data (BLS, EEO-1) | Free; geographically granular | Occupational categories too broad for most role-matching; significant data lag |
| Job posting analytics | Reflects current advertised rates | Advertised ranges often wider than actual pay; self-reported; inconsistently formatted |
| Recruiter intelligence | Current; role-specific; candidate-facing | Small sample; subjective; not statistically defensible |
| KEY TAKEAWAY Most organizations should use two data sources: one traditional survey for depth and defensibility, and one real-time platform for currency. Relying on a single source, particularly an annual survey, means your pay decisions are calibrated to market conditions that may no longer reflect competitive reality. |
Data freshness matters more than most organizations realize
Compensation benchmarking data has a shelf life. In stable talent markets, salary benchmarks may be reliable for 12-18 months. In high-demand segments such as technology, healthcare, and financial services, market rates for specific roles can shift 10-15% in a single year. A benchmarking exercise based on data from 18 months ago may be systematically underpricing roles in exactly the segments where your attrition risk is highest.
5. Step 3: Match Your Roles to Market Data
Role matching is the most technically demanding step in the benchmarking process and the most common source of error. The goal is to identify the market job description that most closely represents the actual work your employees perform, not to match on title.
Matching principles
- Match on job content, not job title: a ‘Senior Manager’ at one organization may be a ‘Director’ in another’s salary survey
- Match on the middle of the role: if the survey job is slightly above or below your role in scope, note the deviation and adjust
- Match to the role as it is performed, not as it was designed: if an employee’s actual responsibilities exceed the original job description, match to what they actually do
- Document every match: record which survey job was selected, why, and whether any adjustments were applied
| DATA WARNING Overly aggressive upward matching (selecting a higher-scope survey job to justify higher pay) is the most common manipulation in compensation benchmarking. It produces ranges that appear market-competitive but are actually above market for the role as performed. Governance over the matching process, with a designated reviewer who approves matches for critical roles, is essential. |
Handling hard-to-match roles
Some roles, particularly highly specialized technical roles, newly created functions, or roles unique to your industry, will not match cleanly to any survey job. In these cases, use a blended approach: identify the two closest survey matches, weight them by the percentage of the role they represent, and document the methodology. Roles that cannot be matched within ±15% of scope should be flagged for a custom analysis.
6. Step 4: Analyze the Data
With roles matched and data in hand, the analysis has two layers: understanding where the market sits for each role, and understanding where your employees sit relative to that market.
Market analysis
For each benchmarked role, compile the following data points: 25th percentile, median (50th), 75th percentile, and 90th percentile for base salary and total cash. Where available, add geographic differentials for remote-friendly roles or multi-location organizations.
Internal analysis
Once market ranges are established, calculate each employee’s compa-ratio: their current salary divided by the market midpoint for their role and level. Compa-ratio analysis reveals the distribution of pay within and across roles.
| Compa-Ratio | Interpretation |
| Below 80% | Significantly below market; high attrition risk; immediate review warranted |
| 80–90% | Below market; warrants attention in next compensation cycle |
| 90–110% | At market; appropriate for employees meeting expectations |
| 110–120% | Above market; sustainable for high performers or long-tenured employees |
| Above 120% | Significantly above market; compression risk; review hiring and increase practices |
| KEY TAKEAWAY Compa-ratio analysis is most valuable when run by demographic group. If women in a given role cluster below the 90th compa-ratio while men cluster above 100%, that pattern is a pay equity signal, not a coincidence. Benchmarking and pay equity analysis are not separate workstreams. Run them together. |
7. Step 5: Apply Findings to Your Compensation Structure
Analysis that does not produce decisions is not analysis: it is documentation. Once the benchmarking data is interpreted, it must translate directly into compensation structure updates.
Band updates
Review existing compensation bands against benchmarked market ranges. Bands that have drifted below the 40th-50th market percentile for their midpoint should be adjusted in the current compensation cycle. Bands that are above the 75th percentile should be reviewed for strategic intent: is there a deliberate reason these roles are priced above market, or is this a legacy artifact that is creating cost inefficiency?
Individual remediation
Employees with compa-ratios below 80% against the updated benchmarks warrant individual pay review. Prioritize by role criticality and flight risk. Document the remediation rationale and tie adjustments to the compensation cycle where possible for budget predictability.
Offer calibration
Update offer ranges for active and upcoming requisitions based on the new benchmarks. Offers extended using outdated benchmarks are a primary driver of new hire pay compression, situations where newly hired employees are paid at or above tenured colleagues performing at a higher level.
| REMEDIATION RULE Compensation remediation should always move pay upward. Never reduce salaries that benchmark above market. The reputational and retention cost of a pay cut exceeds any short-term savings. Where cost management is necessary, address it through hiring and promotion decisions, not by reducing pay for current employees. |
8. Step 6: Build a Continuous Benchmarking Program
A single benchmarking exercise has a half-life. Organizations that benchmark once and apply the results for two or more years are systematically exposed to market drift in the exact windows when labor market conditions change most quickly.
Recommended benchmarking cadence
| Activity | Frequency |
| Full compensation benchmarking cycle | Annually, aligned to merit cycle planning |
| Spot checks for high-demand roles | Quarterly or when attrition spikes in a job family |
| New hire offer calibration review | Before extending any offer; use current market data |
| Band range review post-merit cycle | Immediately after merit increases are finalized; check for compression |
| Market data source review | Annually; evaluate whether current providers reflect current market conditions |
Embedding benchmarking into HR workflows
- Pre-offer review: flag any offer below the 40th market percentile before extending, requiring compensation team approval
- Merit cycle preparation: run a benchmarking refresh as the first step of merit cycle planning, before budget allocation
- Promotion review: recalibrate pay range expectations for employees moving into new levels
- Departure analysis: track whether departing employees’ pay at departure was below, at, or above market to identify compensation-driven attrition
9. Common Mistakes in Compensation Benchmarking
| Mistake | Why It’s a Problem | Better Approach |
| Using a single annual survey as the only data source | 12-18 month data lag; may not reflect current competitive conditions | Pair traditional surveys with real-time benchmarking data |
| Matching roles by title instead of content | Title inflation across the market produces misleading benchmark comparisons | Match by job scope and responsibility; document every match decision |
| Applying a single percentile target across all roles | Leaves critical roles underpriced and low-impact roles overpriced | Differentiate target percentile by role criticality and market competitiveness |
| Benchmarking base salary in isolation | Understates total comp for roles with significant variable or equity components | Benchmark total cash and total compensation for roles where these matter |
| Not running compa-ratio analysis by demographic group | Misses pay equity signals embedded in the benchmarking data | Run compa-ratio distribution by gender and race/ethnicity as a standard step |
| Treating benchmarking as a project, not a program | Market conditions shift faster than annual benchmarking cycles can track | Embed quarterly spot checks and pre-offer reviews into recurring HR workflows |
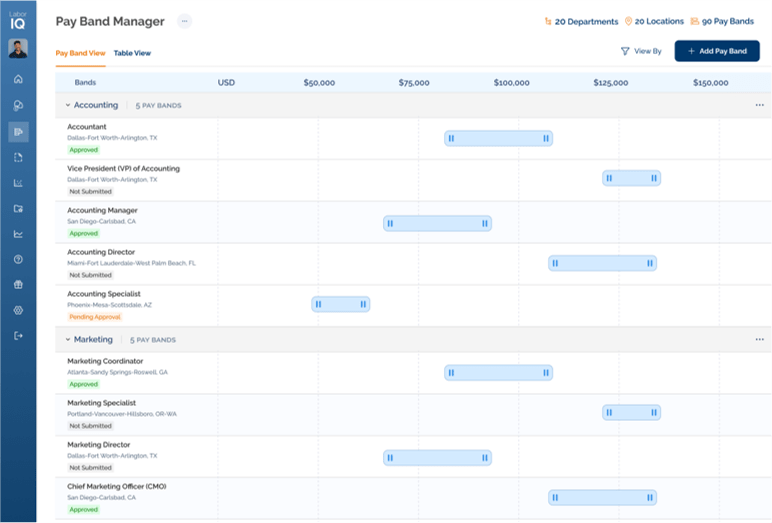
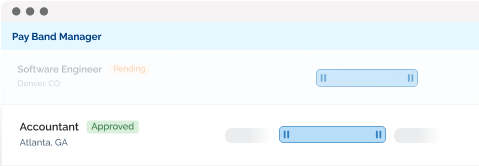
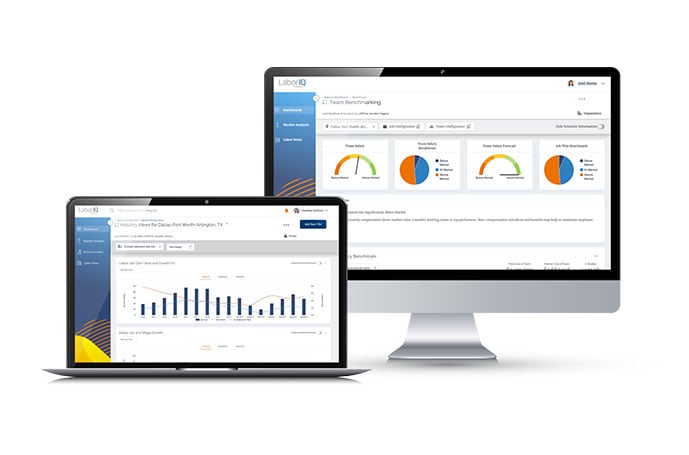
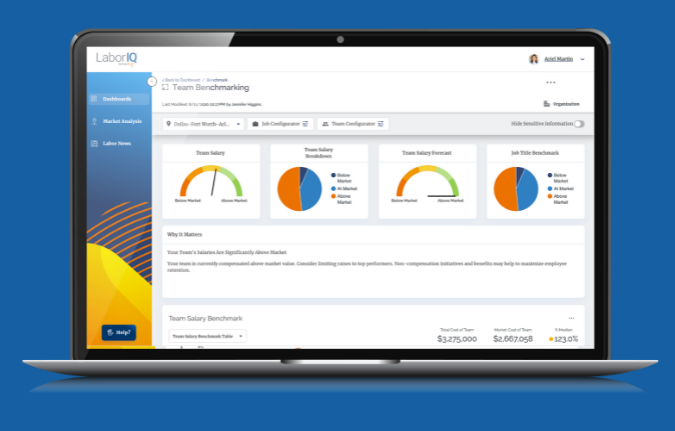
10. How LaborIQ Supports Compensation Benchmarking
| LABORIQ PLATFORM Compensation Intelligence Built for HR Leaders ✓ Real-time salary benchmarks at the 25th, 50th, 75th, and 90th percentiles ✓ Role matching across thousands of job families and levels ✓ Geographic pay differential analysis for remote and multi-location organizations ✓ Compa-ratio reporting segmented by gender, race/ethnicity, and tenure ✓ Band design and market positioning scenario modeling → Request a Free Demo at laboriq.co/request-demo |
| Benchmarking Phase | How LaborIQ Helps |
| Market data sourcing | Access continuously updated salary data across industries, geographies, and company sizes, with no 12-month lag |
| Role matching | Match internal roles to standardized job families with validated market comps |
| Percentile analysis | View 25th/50th/75th/90th percentile benchmarks for any role with geographic adjustment |
| Compa-ratio analysis | Calculate and segment compa-ratios across the employee population by role, level, and demographic group |
| Band construction | Model compensation band ranges at your target percentile with midpoint, minimum, and maximum calculations |
| Offer calibration | Run real-time offer benchmarks before extending to any candidate |
Unlike annual compensation surveys, which reflect market conditions from 12 to 18 months ago, LaborIQ’s data is continuously updated from live market sources. That currency matters particularly in high-demand talent segments where compensation benchmarks shift fastest and where the cost of being out of market is highest.
11. Frequently Asked Questions
| Q: How often should we benchmark compensation? At minimum, annually, aligned to your merit cycle planning timeline. For roles in high-demand talent segments such as software engineering, data science, clinical healthcare, and financial services, quarterly spot benchmarking is worth the effort. Markets in these segments can move 8-15% in a single year, meaning a benchmark from 12 months ago may already be meaningfully out of date. |
| Q: What is the difference between a salary survey and a benchmarking strategy? A salary survey is a data source. A benchmarking strategy is the process, methodology, and governance model you use to translate data sources into pay decisions. Most organizations have access to salary surveys but lack a benchmarking strategy, which is why they end up with data they do not know how to apply consistently. |
| Q: How do we handle benchmarking for remote or globally distributed roles? Remote roles complicate benchmarking because the relevant labor market depends on your pay policy: do you pay based on the employee’s location, a single national rate, or a hybrid? Establish your remote pay policy first. Once the policy is defined, benchmarking follows: geographic adjustments are available from most data providers for major metro areas and can be applied against a national baseline. |
| Q: What does ‘market compensation data’ mean, and how current is it? Market compensation data is the aggregated salary information collected from employers, whether through surveys, HRIS integrations, or job posting analytics, and used to establish pay benchmarks. Traditional survey data is typically 12-18 months old by the time it is published. Real-time platforms refresh continuously from live sources. For most organizations, a combination of both provides the depth and currency needed for reliable benchmarking. |
| Q: How do we benchmark compensation for highly specialized or newly created roles? For specialized roles, identify the two closest market analogs, weight them by the percentage of the role each represents, and document the blended methodology. For truly novel roles with no clear market comp, survey the immediate competitive talent pool directly through recruiter intelligence and supplement with the closest available job family data. Revisit the benchmark every six months until a more established market develops. |
LaborIQ Editorial Team | Compensation Research & Strategy · LaborIQ
The LaborIQ editorial team is composed of compensation analysts, HR practitioners, and workforce economists. Our content is grounded in real-time labor market data and reviewed by certified compensation professionals. LaborIQ is a compensation intelligence platform helping organizations benchmark, plan, and optimize pay with confidence.