Table of Contents
1. What are salary range percentiles?
| DEFINITION Salary Range Percentile A salary range percentile is a statistical marker that shows how a specific salary compares to all other salaries in the market for the same or similar role. It tells you not just what a job pays, but where that pay falls across the full distribution of what employers are offering. |
When companies refer to the 25th, 50th, or 75th percentile in salary data, they are answering a single core question: where does this salary sit relative to the broader market?
For example, a salary at the 75th percentile is higher than 75 percent of comparable roles in the market — and lower than the top 25 percent. That single data point tells a compensation team a great deal about competitiveness, risk, and strategy.
Understanding how percentiles work is foundational to building competitive salary ranges, making defensible hiring decisions, maintaining internal equity, and staying compliant with pay transparency requirements.
| KEY STAT According to WorldatWork, more than 80% of organizations use market percentile data as the primary input for setting and adjusting salary ranges — making it the single most widely used compensation benchmark in practice. |
2. What do the 25th, 50th, and 75th percentiles mean in salary?
These three benchmarks are the most commonly used reference points in compensation strategy. Here’s what each one means — and when organizations typically use them.
| 25TH PERCENTILE Lower end of market Pay is higher than 25% of the market. Typically reflects early-career or less experienced employees. Use when: Entry-level hiring, cost-control roles, high training/development investment | 50TH PERCENTILE Market midpoint (median) Half of market salaries are above, half below. The standard benchmark for a fully competent employee. Use when: Matching the market, stable industries, strong non-cash value proposition | 75TH PERCENTILE Above-market positioning Pay is higher than 75% of the market. Used to attract or retain high-value, specialized talent. Use when: Hard-to-fill roles, competitive talent markets, aggressive growth phase |
It’s worth noting that percentiles don’t exist in isolation. Most organizations use a combination of these benchmarks to define the minimum, midpoint, and maximum of a salary band — with the 50th percentile often anchoring the midpoint.
What does the 25th percentile mean in salary?
The 25th percentile represents the lower end of competitive pay for a role. Salaries at this level are higher than 25 percent of the market but below the remaining 75 percent. This is not inherently a “low” offer — for entry-level roles or positions where the employer provides exceptional training, development, or non-cash value, the 25th percentile can be entirely appropriate.
Organizations that consistently pay at or below the 25th percentile for competitive roles, however, typically experience higher voluntary turnover and struggle to attract experienced candidates.
What does the 75th percentile mean in salary?
The 75th percentile signals an above-market commitment. Paying at this level means the organization is paying more than 75 percent of competitors for the same role. This is a deliberate strategy — typically used for specialized talent, mission-critical positions, or roles where the cost of vacancy is high.
It’s important not to apply 75th percentile positioning across the board. Doing so significantly increases payroll costs without a proportional return in retention or performance for every role.
3. How are salary range percentiles used in practice?
Compensation teams use percentiles in several interconnected ways throughout the employment lifecycle.
| Use Case | How Percentiles Apply |
| Setting salary ranges | Percentiles define the min, midpoint, and max of each band — typically anchored at the 50th percentile midpoint |
| Making job offers | Recruiters use percentile targets to build offers that are competitive without exceeding budget guidelines |
| Annual merit planning | Percentile positioning informs merit increase recommendations — employees below midpoint may receive larger increases |
| Market alignment reviews | Roles that have drifted below the 25th percentile are flagged for market adjustments during or outside the comp cycle |
| Pay equity analysis | Comparing employee pay to percentile benchmarks by demographic group helps surface systemic pay gaps |
| Geographic adjustments | Percentiles are applied at the local market level to reflect cost-of-labor differences by city or region |
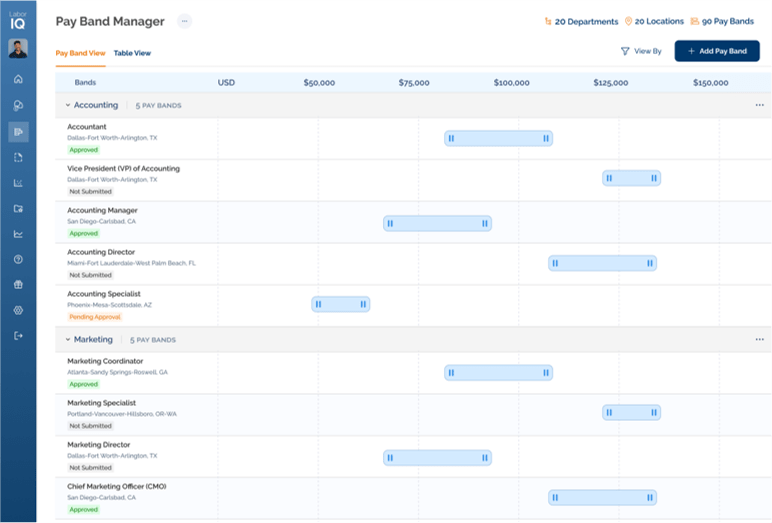
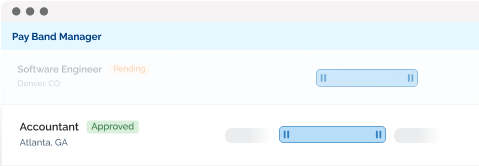
One of the most important practical applications is in salary band design. A typical band structure looks like this:
- Band minimum: often set at the 25th percentile, representing the floor for a qualified but less-experienced hire
- Band midpoint: anchored at the 50th percentile, representing a fully competent, experienced employee in the role
- Band maximum: typically set at the 75th or 90th percentile, representing the ceiling for exceptional performers or highly tenured employees
4. How do you calculate the 75th percentile of a salary range?
Understanding the mechanics behind percentile calculations helps clarify both where the numbers come from and why data quality matters so much.
At a conceptual level, calculating the 75th percentile of a salary dataset involves:
1. Collect salary data
Gather salaries for a specific role across the market — ideally from a large, validated dataset covering many employers, industries, and geographies.
2. Sort from lowest to highest
Arrange all salary observations in ascending order. The distribution of values across this range is what percentiles measure.
3. Identify the 75th position
Multiply the total number of data points by 0.75. The salary at or near that position in the sorted list is the 75th percentile.
4. Interpolate if needed
With large datasets, statistical interpolation between adjacent data points is often used to produce a precise percentile value rather than selecting the nearest observation.
| WHY THIS MATTERS Small or self-selected datasets produce unreliable percentiles. A sample of 12 salaries for a Software Engineer role will produce very different percentile values than a validated dataset of 10,000 observations. This is why most organizations rely on compensation platforms with large, continuously updated datasets rather than attempting manual calculations. |
| Q: Can I calculate salary percentiles from publicly available data? A: You can attempt it, but the results are rarely reliable. Public salary data — from job boards, Glassdoor, or government sources — tends to be self-reported, incomplete, and not segmented by level, industry, or geography with enough precision to be actionable. Purpose-built compensation platforms provide validated, methodology-audited percentile data that is far more defensible for pay decisions. |
5. Why do percentiles matter for building salary ranges?
Salary ranges don’t exist in a vacuum — they’re derived from market data, and percentiles are the primary lens through which that data is interpreted and applied.
Here’s why getting percentile strategy right matters:
- Competitive offers: If your salary band’s maximum is at the market 50th percentile, you’ll lose candidates who have competing offers at the 75th percentile — even if your total compensation package is stronger.
- Retention: Employees whose pay has drifted below the 25th percentile for their role are statistically far more likely to leave. Regular percentile-based audits catch this drift before it becomes a flight risk.
- Internal equity: Percentile-anchored bands ensure that employees in the same role are paid within a consistent range — reducing the risk of disparate pay based on negotiation, tenure, or manager preference.
- Pay progression: Bands built around percentile anchors give employees a clear, data-backed path for understanding how their pay can grow — which reduces pay anxiety and improves manager-employee conversations.
- Budget predictability: Defined percentile targets let Finance model the cost of merit cycles, market adjustments, and headcount growth with much greater precision.
| KEY TAKEAWAY The midpoint of a well-designed salary band should be anchored to the market percentile that reflects your compensation positioning strategy. If that midpoint drifts out of alignment with the market, the entire band — and every decision made within it — becomes unreliable. |
6. Salary percentile vs. salary average: what’s the difference?
This is one of the most common points of confusion in compensation data. Averages and percentiles measure different things — and they can tell very different stories about the same dataset.
| Metric | What It Measures | When to Use It | Key Limitation |
| Average (mean) | Sum of all salaries divided by count | General reference; budget modeling | Distorted by outliers — one $500K executive skews the average significantly |
| Median (50th pct) | The middle value in a sorted dataset | Standard market benchmark; band midpoint anchoring | Doesn’t capture distribution spread above or below |
| 25th percentile | Lower quartile of market pay | Setting band minimums; entry-level benchmarking | May not reflect experience premiums |
| 75th percentile | Upper quartile of market pay | Competitive positioning; senior/specialized roles | Can be expensive to target universally |
| 90th percentile | Near top of market | Executive roles; critical retention plays | Significant payroll cost; hard to sustain broadly |
In most compensation contexts, the median is a more reliable benchmark than the average — because it isn’t distorted by a small number of very high or very low outliers. This is why compensation professionals almost always lead with percentile data rather than averages when designing pay structures.
7. How percentiles fit into modern compensation strategy
As compensation becomes more data-driven and pay transparency expectations increase, percentiles are playing a larger and more visible role in how organizations manage pay.
Key areas where percentile strategy is becoming more sophisticated:
Geographic pay differentiation
A national 50th percentile for a Software Engineer role can mask enormous geographic variation. The 50th percentile in San Francisco may be 40 percent higher than the same percentile in Nashville. Organizations with distributed or remote workforces need location-adjusted percentile benchmarks to avoid both overpaying in lower-cost markets and underpricing in high-cost ones.
Role-level differentiation
Mature compensation strategies don’t apply a single percentile target across all roles. Revenue-generating, specialized, or mission-critical roles may be targeted at the 75th percentile, while support functions or roles with lower market competition may be positioned at the 50th. This tiered approach maximizes competitive impact per compensation dollar spent.
Pay transparency compliance
As more states require salary ranges in job postings, organizations need percentile-anchored bands that are defensible, consistent, and regularly updated. A band that was accurate at the 50th percentile 18 months ago may now reflect only the 35th percentile — creating legal and reputational exposure.
Continuous benchmarking
Static annual salary surveys are increasingly insufficient in fast-moving talent markets. Modern compensation platforms provide real-time percentile data so that ranges can be validated and updated as market conditions shift — rather than waiting for the next survey cycle.
8. Common mistakes when using compensation percentiles
Percentiles are powerful tools — but they are frequently misapplied. Here are the most common errors and how to avoid them:
| Mistake | Why It’s a Problem | Better Approach |
| Applying the same percentile to every role | Over-spends on low-competition roles; under-invests in critical ones | Differentiate percentile targets by role type, criticality, and market competition |
| Using outdated benchmarks | Pay ranges drift out of market alignment without anyone noticing | Refresh percentile benchmarks at least annually; quarterly in volatile markets |
| Treating percentiles as fixed targets | Creates rigidity that ignores individual performance and experience | Use percentile anchors as band guardrails, not individual pay mandates |
| Ignoring geographic variation | National percentiles mask significant regional pay differences | Apply location-adjusted percentile data for distributed or hybrid workforces |
| Confusing average with median | Averages skewed by outliers lead to miscalibrated bands | Always use the median (50th percentile) as the primary market anchor, not the mean |
| Small sample sizes | Unreliable percentiles from thin data lead to poor decisions | Use validated, large-sample datasets from compensation platforms |
9. Who should use percentile-based compensation data?
Percentile benchmarking isn’t just for large enterprise compensation teams. Here’s who benefits most — and how:
- HR leaders and people ops teams who need to build or refresh salary bands and ensure internal pay equity across a growing workforce.
- Recruiters and talent acquisition leaders who need percentile-anchored offer ranges to move quickly and competitively without overshooting budget.
- HR consultants who advise clients across industries and need access to credible, segmented percentile data to support pay structure work.
- Finance and CFOs who need to model the cost of compensation strategies — including the budget impact of targeting different percentiles for different role families.
- Founders and operators at growing startups formalizing their first salary bands and needing a data-backed starting point rather than guesswork.
| Q: Do small companies need to use percentile data? A: Yes — arguably more than large ones. Large enterprises have dedicated compensation analysts and established bands. Small and mid-sized companies making ad hoc pay decisions without percentile anchors are most at risk of pay compression, equity issues, and competitive drift. A reliable percentile benchmark is the fastest way to establish a defensible pay structure at any size. |
10. How LaborIQ supports percentile-based pay decisions
LaborIQ provides real-time salary benchmarks at the 25th, 50th, 75th, and 90th percentiles for every job in the U.S. — so compensation teams, HR leaders, and recruiters always have current, validated market data to anchor their pay decisions.
| LABORIQ PLATFORM Percentile-driven benchmarking, built for HR teams LaborIQ provides real-time salary benchmarks at every percentile for every U.S. role — so your pay ranges are always grounded in current market data, not last year’s survey. ✓ Real-time percentile benchmarks for every U.S. role ✓ Salary data segmented by industry, level, and geography ✓ Pay Band Manager™ for building percentile-anchored bands ✓ Compa-ratio analysis to track employee positioning within bands ✓ Geographic pay adjustment at the city and metro level ✓ Total compensation reporting — not just base salary→ Request a Free Demo at laboriq.co/request-demo |
Unlike annual salary surveys — which can reflect market conditions from 12 to 18 months ago — LaborIQ’s data is continuously updated. That means your percentile benchmarks reflect the market as it is today, not as it was last fiscal year.
When should you use LaborIQ for percentile benchmarking?
- When building or updating salary bands and you need validated 25th/50th/75th percentile anchors for each role
- When making a competitive offer and you need to confirm whether the number is at, above, or below the market 50th percentile for that role and location
- When running an annual pay equity audit and you need to compare employee salaries to current market percentiles by role, level, and geography
- When preparing for pay transparency compliance and you need defensible, regularly updated salary ranges tied to current market percentiles
11. Frequently asked questions
| Q: What percentile should we target for our salary ranges? A: It depends on your strategy. Most organizations target the 50th percentile as a baseline — meaning they aim to match the market. Organizations in competitive talent markets, or those hiring for specialized or hard-to-fill roles, often target the 65th to 75th percentile. The key is to be intentional and consistent — and to document why different roles are targeted at different levels. |
| Q: Is the 50th percentile the same as the average salary? A: No — and this distinction matters. The 50th percentile is the median, meaning exactly half of salaries in the dataset are above it and half are below. The average (mean) is the sum of all salaries divided by the count. In compensation data, a small number of very high salaries can pull the average significantly above the median. For benchmarking purposes, the median is almost always the more reliable reference. |
| Q: How often should we update our percentile benchmarks? A: At minimum, annually — aligned to your compensation cycle. In fast-moving talent markets (technology, healthcare, finance), quarterly validation is worth the effort. Markets can shift by 5 to 15 percent in a single year for high-demand roles, meaning a band set at the 50th percentile can drift to the 35th without any action on your part. |
| Q: Can we use different percentile targets for different roles? A: Yes — and most mature compensation programs do. Revenue-critical roles, specialized technical positions, and hard-to-fill functions often justify 75th percentile targeting, while administrative or support roles in lower-competition markets may be positioned at the 50th. A differentiated approach maximizes the strategic impact of your compensation spend. |
| Q: What’s the difference between the 75th percentile and the 90th percentile? A: The 75th percentile places you in the upper quartile of the market — competitive and above average, but not extreme. The 90th percentile places you in the top 10 percent of payers for a given role. Organizations typically reserve 90th percentile targeting for executive roles, uniquely specialized positions, or situations where the cost of vacancy or replacement is extremely high. |
| Q: How do geographic differences affect salary percentiles? A: Significantly. A role benchmarked at the 50th percentile nationally may correspond to very different dollar amounts in different cities. A Software Engineer at the national 50th percentile might earn $115K, while the 50th percentile for the same role in San Francisco is $145K and in a mid-sized Midwest city is $95K. Always apply location-adjusted percentile data for geographic pay decisions. |