
October 2026 U.S. job market & compensation report: The last data points for 2027 compensation planning
Most organizations are finalizing 2027 salary budgets right now, which makes the October jobs report one of the final data points HR and finance leaders will have in hand for those decisions.
The headline numbers
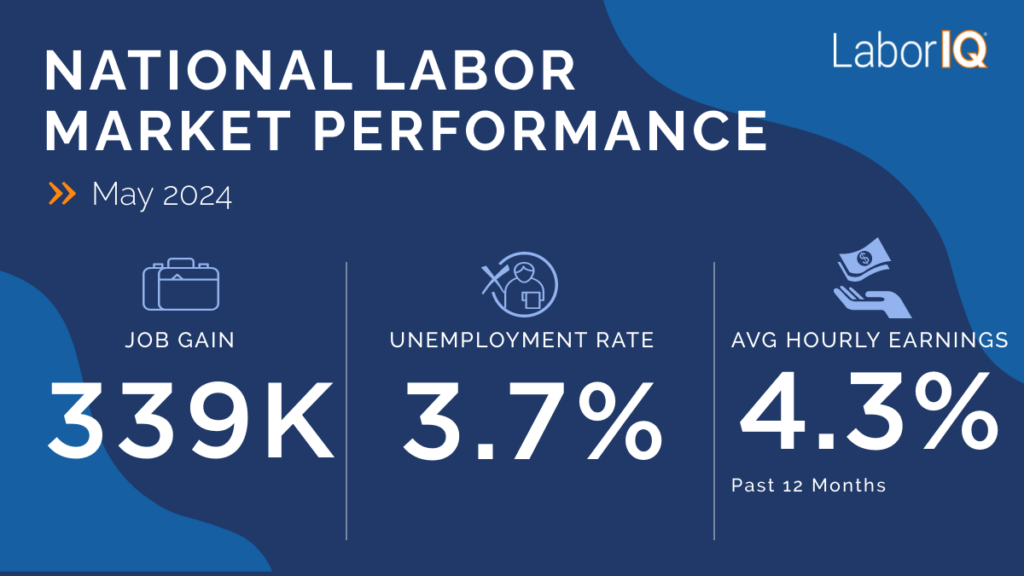
U.S. employers added 165,000 jobs in October, more than double expectations of around 60,000. The unemployment rate ticked down to 4.1%, and 12-month wage growth ticked up to 3.1%.

On the surface, this is the best jobs report in over a year. Recently digging deeper into industries has told a more negative story about the labor market with hiring concentrated in just a few sectors – that is not the case this month.
October’s gains reached more of the economy than recent reports. Health care added 42,000 jobs, about one-quarter of the monthly total. Professional and business services (+70,000) posted the largest gain.
Several other sectors contributed meaningful gains. Trade, transportation and utilities added 22,000 jobs, manufacturing added 19,000, and social assistance added 14,000.

Losses were smaller and fewer. Leisure and hospitality (-13,000) posted the largest decline, and construction slipped 3,000 jobs after being a bright spot in September. Most other declines were 2,000 jobs or fewer.
The yearlong view is less even. Over the past 12 months, information (-119,000), financial activities (-99,000) and the federal government (-71,000) have shed jobs, while health care has added 377,000, more than 40% of the 885,000 total jobs added.
A single month of data rarely tells the full story. To understand where pay is headed, it helps to look at where it has been. Over the past decade, wage growth has moved through four distinct eras, and each one changed how HR teams budget, benchmark and set pay.
The eras of compensation planning in the U.S., 2015-2026
Each era came with its own assumptions about what a “normal” raise looks like. Many of those assumptions are still built into merit matrices and pay bands today.

2015-2019: Set it and forget it
The Great Recession was largely in the rear-view mirror. Average annual wage growth held at 2.3% from 2015 through 2019, ranging from 1.8% to 3.0%. Inflation was low and predictable, and so were raises.
For most organizations, compensation planning was an administrative exercise. Merit budgets carried over from one year to the next with little adjustment, and pay rarely sat at the forefront of HR strategy.
The challenge is that many pay structures still in use today were designed during this era, for a labor market that moved slowly and predictably.
💡 A pay band set in 2017 and adjusted only by annual merit increases is likely out of step with today’s market, even if it was accurate when it was built.
2020-2021: Pandemic (re)adjustment
Pandemic rehiring and the Great Resignation, a period of record job switching, pushed wage growth to 5.4% in 2020 and 9.1% in 2021. That’s an average of 7.3% over the two years.
Annual planning cycles couldn’t keep pace. HR teams turned to off-cycle adjustments, retention bonuses and counter offers to hold on to staff and fill open roles. New hires often came in at or above the pay of tenured employees in the same role.
Those decisions solved immediate problems but created lasting ones. Pay compression and internal equity gaps from this period still linger in many organizations.
2023-2025: The new normal for employee expectations
After a reset in 2022, wage growth settled at a 3.5% average from 2023 through 2025. Pay increases outpaced a declining inflation rate, so workers saw real wage gains, while hiring normalized from post-pandemic highs.
Employee expectations, however, did not return to 2019 levels. A 3% merit budget that felt generous in 2018 became the baseline workers expect each year.
2026: Talent retention strategy in focus
LaborIQ forecasts median wage growth of 2.9% and average wage growth of 3.1% in 2026. Fewer workers are receiving raises above 4%, largely because fewer people are switching jobs, and job switchers typically get the biggest pay bumps.
At the same time, renewed inflation and economic uncertainty are squeezing workers and businesses alike. With prices rising faster than paychecks, real wages are falling just as pay budgets tighten.
💡 When budgets can’t stretch to cover everyone, where raises go matters more than the size of the average raise.
What this means for 2027 compensation planning
LaborIQ forecasts average annual wage growth of 3.0% in 2027. That figure is useful context, but budgeting around a single national number would repeat the set-it-and-forget-it approach of the pre-pandemic era, especially with an uncertain economy and focus on tightening budgets.
A few priorities for the cycle ahead:
- Budget on market data, not last year’s merit percentage. The right increase for a role depends on what that role commands in your markets today and where pay is forecast to go.
- Target retention dollars. Direct increases toward hard-to-fill roles, flight-risk employees and top performers rather than spreading the budget evenly.
- Audit pay bands for compression. Off-cycle decisions made in 2020 and 2021 may have left tenured employees paid below recent hires.
- Revisit data throughout the year. Conditions now shift faster than annual survey cycles can capture. Build plans on three- to six-month trends and update them midyear as forecasts change.
LaborIQ updates compensation and labor market data monthly, so HR teams can plan around today’s market rather than last decades. Pay Analysis benchmarks team-wide compensation and forecasts future pay needs, Pay Band Manager helps identify and correct compression, and Salary Answers delivers role- and location-specific pay recommendations for every U.S. market.

LaborIQ provides HR teams and business leaders with market-competitive compensation benchmarks. In an evolving job market, you need to know what salaries to offer to retain employees and fill open positions faster.
Want to hear about how LaborIQ can help your HR team? Learn more