🚀 Now available! Analyze workforce pay alignment with Pay Analysis™!

Learn More
LaborIQ

Labor Market Reports | October 2, 2026

Stability not momentum in September jobs report

September 2026 U.S. job market & compensation report: New normal for hiring and pay strategy

September’s jobs report confirms what many HR teams already feel: hiring has slowed, but finding talent hasn’t gotten easier.
The headline numbers

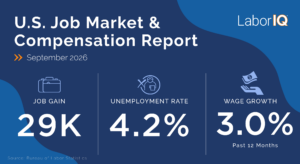
Employers added 29,000 jobs in September, below expectations of around 90,000. The unemployment rate ticked up to 4.2%, and 12-month wage growth ticked down to 3.0%.

Job gains for July and August painted a rosy picture of the labor market. As expected, those hiring totals were revised downward – there were 60,000 fewer jobs added in the last two months than original estimates indicated. These revisions bring the three-month average to 51,000 new jobs.

💡 Revisions tend to be larger during periods of uncertainty – look at three- or six-month trends, not a single report, before making budget or hiring decisions.
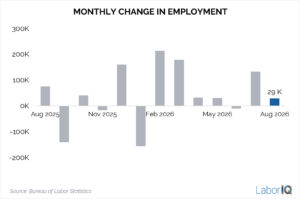
The U.S. labor market is holding steady, but steadiness and stability don’t always translate into momentum for businesses or prospects for job seekers. Conditions vary widely by industry and location.

A new normal for job growth

One challenge of explaining the labor market over the past several years is that we are in a period of realignment, redefining the benchmarks for normal or healthy economic metrics.

Historically, 4.5% was the baseline for full employment where nearly everyone that wanted a job had one. Similarly, 2% annual wage growth was the norm for a couple of decades in an era of modest inflation.

Using benchmarks from 2015–2019, especially in compensation planning, will not be a viable strategy going forward.

💡 Compensation leaders wouldn’t price a role using a seven-year-old salary survey. That same logic applies to reading labor market data.

Demographic and migration trends are reshaping job growth

Businesses can hire, either backfilling open roles or creating new positions, from the combined active (unemployed and looking for work) and passive (employed) talent pool.

That talent pool is the U.S. labor force: the population 16 and older who are either employed or unemployed and looking for work. Labor force growth has been flat since early-2025, but recent declines mean the labor force has nearly a million fewer people than it did in September 2025.

Labor force growth has stalled because individuals are aging out of the workforce and international migration has slowed substantially.

The labor force is essentially the ceiling for new job growth. So, when the labor force stops growing, businesses can’t hire beyond that limit, and fewer net job gains are needed to keep unemployment from rising.

Think of job gains as the economy’s backfill number. When the workforce is growing quickly, employers need 100,000 or more new jobs a month to keep unemployment steady. With the workforce shrinking, that backfill number is much lower. A month of 29,000 job gains isn’t strong, but it is also not the warning sign it would have been a decade ago.

💡 With a shrinking talent pool, the easiest hire is the one you keep. Retention and internal mobility are more important than ever. Sectors like healthcare, leisure and hospitality, and construction are most likely to face constraints, and therefore wage pressures, as a result of declining migration.

Industry concentration

Once again, job gains are concentrated in a few industries. Most sectors are treading water.
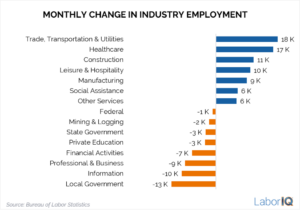
Trade, transportation and utilities (+18,000) posted the largest gain in September, with gains in most subsectors across wholesale trade, retail trade, and transportation.

Healthcare (+17,000) accounted for nearly 60% of jobs added in September and three-quarters of jobs added in the last year. The healthcare industry has supported job growth totals since 2023. Demand for healthcare workers continues to grow as the U.S. population ages. The industry is expected to account for the largest share of new jobs added over the next decade.

Construction (+11,000) has been another bright spot among U.S. industries, bolstered by AI and data center projects. Except for residential specialty trade contractors, all construction subsectors added jobs in September.

Growth in healthcare and construction comes despite slower migration, which makes home health aides, medical technicians, and skilled trade workers harder to find and more expensive to hire.

Employment in private-sector office jobs moved in the other direction. Financial activities (-7,000), professional and business services (-9,000) and information (-10,000) lost a combined 26,000 jobs, nearly offsetting healthcare gains.

💡 Employers in growing sectors face increasing competition for a shrinking talent pool amid growing shortages for front line, care, and skilled trade workers. In many other industries, employers are focused on retaining current staff and budgeting for merit increases despite growing inflation pressures. Either way, plan recruiting and pay strategy by role, not by national averages.

Unemployment remains low

Unemployment rose to 4.2% from 4.1%. The good news is that the unemployment rate rose because of new entrants to the labor force over the past couple of months. When people enter or return to the labor market, they count as unemployed until they’re hired. So, a rising rate can mean more people want jobs, not that more people lost them.

💡 A higher unemployment rate isn’t always bad news. People entered the labor force the last two months looking for work, but not always for the roles that are hardest to fill or in industries that are hiring most frequently.

Compensation is cooling faster than expected

Annual wage growth fell to 3.0% in September, down from 3.1% in August and 3.7% in February. Wage growth has cooled faster than expected this year, while inflation has moved the other way, rising to 3.4%. With prices growing faster than paychecks, real wages are falling.

For HR teams, that creates a squeeze. Employees feel their pay buying less, just as pay budgets are tightening. LaborIQ’s national pay forecasts have come down along with wage growth, but not evenly across roles and levels.

Pay is still rising for some roles where talent is scarce. But more roles may see lower new-hire salaries through 2026 and 2027 as hiring slows across the economy.

What’s driving the slowdown in pay?

Hiring and new job creation have slowed or stalled across most U.S. industries. Job switchers usually get the biggest pay bumps, so when fewer people change jobs, overall wage growth falls.

The good news is that layoffs and unemployment remain low. But this low-hire, low-fire market puts HR and business leaders in a bind: they have to manage tighter budgets amid economic uncertainty while holding on to the people they have. Pay will remain one of the most important retention tools. LaborIQ forecasts average annual wage growth of 3.0% in 2027.

💡 A merit budget that matches the national average won’t keep up with today’s 3.4% inflation. Put increases where they matter most: hard-to-fill roles and the people you can least afford to lose.

What this means for HR and talent teams

A steady labor market isn’t the same as an easy one. Hiring has slowed, the talent pool is shrinking, and pay budgets are tightening just as employees feel prices rising. A few priorities for the months ahead:

  • Plan by role, not by the national average. A 3.0% headline hides very different markets. Some roles are scarce and getting more expensive, while others have plenty of candidates. Benchmark the roles and locations you actually hire for, and set realistic timelines for the hardest ones to fill.
  • Make retention your first hiring strategy. With fewer workers available and fewer people switching jobs, keeping and developing strong performers is faster and cheaper than replacing them. Build internal mobility into workforce plans now.
  • Explain your pay decisions. When raises trail inflation, employees notice. Clear communication about how pay is set, and where your organization is investing, helps keep trust when budgets can’t stretch as far.
  • Budget on trends, not single reports. Revisions and data gaps make monthly numbers noisy. Build plans on three- to six-month trends and revisit them mid-year as forecasts update.


Mallory Author Image - Chief Economist

LaborIQ provides HR teams and business leaders with market-competitive compensation benchmarks. In an evolving job market, you need to know what salaries to offer to retain employees and fill open positions faster.

Want to hear about how LaborIQ can help your HR team? Learn more

Related Posts

Explore The Latest With Labor IQ

October 2, 2026

Stability not momentum in September jobs report

Labor Market Reports

September 4, 2026

Good headline, uneven reality for HR leaders in August jobs report

Labor Market Reports
Header graphic for July.

August 7, 2026

Lots of noise, little clarity in July’s jobs report

Labor Market Reports
Header graphic for May 2026 jobs report.

June 5, 2026

Is the World Cup Behind May’s Hiring Surge? 🏆

Labor Market Reports
Header graphic for December 2025 report.

January 9, 2026

What the low hire, low fire labor means for your compensation and retention strategies

Labor Market Reports
Header graphic for 2026 outlook blue.

December 30, 2025

2026 Outlook: Economic & Labor Market Headwinds Present Unknowns

Labor Market Reports
Header graphic for 2026 labor market events.

December 19, 2025

What labor market events will shape hiring and compensation in 2026?

Labor Market Reports
Header graphic for 2026 Outlook.

December 12, 2025

Webinar Recap: 2026 Labor Market and Compensation Outlook

Employee Retention Hiring Labor Market Reports
Header graphic for September 2025 DATA.

November 21, 2025

What can old data tell us about the current labor market?

Labor Market Reports
Header graphic for November newsletter.

November 7, 2025

Is the labor market unusually balanced? ⚖️

Labor Market Reports
Header graphic for September 2025 Jobs Report.

October 3, 2025

Government shutdown means no jobs report – reprieve from tough news in a challenging economy ⏳

Labor Market Reports
Header graphic for August 2025 Jobs Report.

September 5, 2025

Talent retention, job hugging in focus with hiring stalled📉

Labor Market Reports
July jobs report article.

August 1, 2025

Revisions to U.S. hiring reveal sharp slowdown 📉

Labor Market Reports
York Skyline. Featured image for the LaborIQ article New York Metro Area Employment Trends.

July 31, 2025

New York Metro Area Employment Trends

Labor Market Reports
Houston Skyline. Featured image for the LaborIQ article Houston Metro Area: A Strategic Hub for Talent Acquisition and Business Growth.

July 28, 2025

Houston Metro Area: A Strategic Hub for Talent Acquisition and Business Growth

Labor Market Reports
Chicago Skyline. Featured image for the LaborIQ article Chicago Metro Area Labor Market Analysis: Strategic HR Insights for 2025.

July 14, 2025

Chicago Metro Area Labor Market Analysis: Strategic HR Insights for 2025

Labor Market Reports
Austin skyline

July 3, 2025

Austin Metro Area: A Strategic HR Market Analysis for Talent-Driven Growth in 2025

Labor Market Reports
Dallas Skyline. Featured image for the LaborIQ article Dallas-Fort Worth Metro Area: America’s #1 Labor Market and Migration Destination for 2025.

June 30, 2025

Dallas-Fort Worth Metro Area: America’s #1 Labor Market and Migration Destination for 2025

Labor Market Reports
LA Skyline banner

June 21, 2025

Los Angeles Metro Area Labor Market Analysis: Strategic HR Insights for 2025

Labor Market Reports
Featured image for the LaborIQ article U.S. Pay Transparency Laws: State-by-State Impact on Business Operations and HR Compliance.

June 18, 2025

U.S. Pay Transparency Laws: State-by-State Impact on Business Operations and HR Compliance 

Compensation Labor Market Reports
Featured image for the LaborIQ article Best Practices for Developing and Managing Pay Bands.

June 13, 2025

Generation Z Workforce: Driving Radical Pay Transparency and Purpose-Driven Employment 

Labor Market Reports Hiring
ChatGPT Image July 21, 2025, 08 06 54 AM.

June 10, 2025

Raleigh Metro Area: A Strategic HR Market Analysis for 2025

Labor Market Reports
Header graphic for May 2025.

June 6, 2025

May 2025 jobs report: Compensation pressures heat up despite slower hiring 💸

Labor Market Reports
April 2025 Friday Jobs Report

May 2, 2025

April 2025 Jobs Report: No bad news is good news for hiring

Labor Market Reports
March 2025 Jobs Report.

April 4, 2025

March 2025 Jobs Report: Hiring beats expectations. Uncertainty is real.

Labor Market Reports
January 2025 Jobs Report Stats, from the LaborIQ article January 2025 Jobs Report: Bigger story beneath the surface of January’s jobs report.

February 7, 2025

January 2025 Jobs Report: Bigger story beneath the surface of January’s jobs report

Labor Market Reports
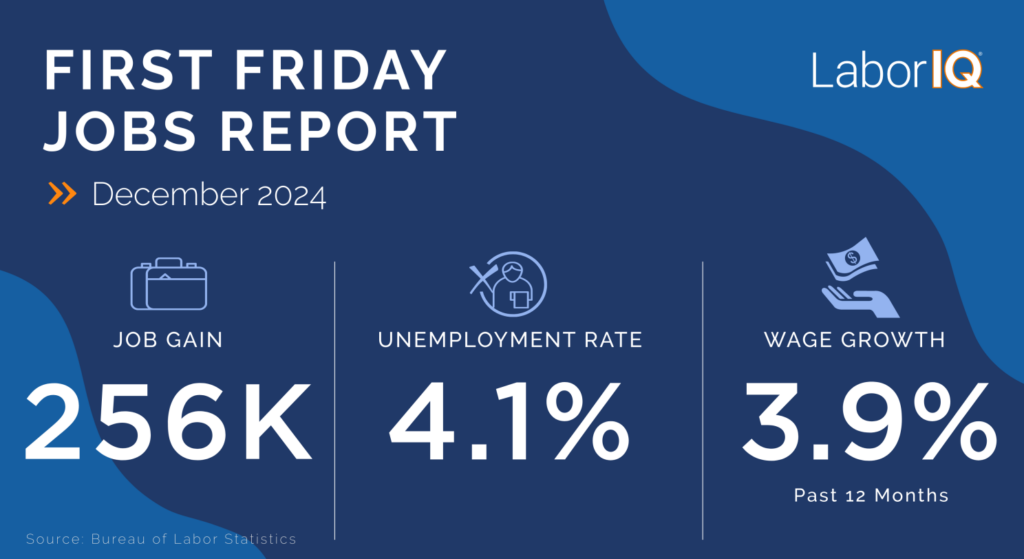
LaborIQ First Friday Jobs Report card for December 2024, showing 256,000 jobs gained, 4.1 percent unemployment and 3.9 percent wage growth over the past 12 months.

January 10, 2025

December 2024 Jobs Report: The Case for Optimism in 2025 ️

Labor Market Reports
Header graphic for November Jobs Report.

December 6, 2024

November Jobs Report: What to watch for as we close out 2024

Labor Market Reports
Header graphic for October Jobs Report.

November 1, 2024

October Jobs Report: Don’t panic over the noisy jobs report

Labor Market Reports
Header graphic for September Jobs Report.

October 4, 2024

Labor market roller coaster: September jobs report brings surprising news

Labor Market Reports
Header graphic for August 2024 Jobs Report.

September 9, 2024

The labor market is moving in the wrong direction ↩️

Labor Market Reports
Header graphic for July Jobs Report.

August 2, 2024

July Jobs Report Hiring slowdown, here’s what that means for employers

Featured Hiring Labor Market Reports
Job candidates waiting for interview.

July 24, 2024

Why Finding A New Job Is So Hard Right Now

Featured Hiring Labor Market Reports
Header graphic for June Jobs Report.

July 9, 2024

June Jobs Report Is the jobs report finally catching up to reality?

Featured Hiring Labor Market Reports
Header graphic for May 2024 Jobs Report.

June 7, 2024

May Jobs Report Is the labor market as strong as headline numbers suggest?

Featured Hiring Labor Market Reports
Header graphic for April Jobs Report.

May 6, 2024

Hiring slows in April, healthcare dominates

Featured Hiring Labor Market Reports
March Jobs Report. Featured image for the LaborIQ article March 2024 Jobs Report: U.S. Employment Boom Continues… for Most Sectors.

April 8, 2024

March 2024 Jobs Report: U.S. Employment Boom Continues… for Most Sectors

Hiring Labor Market Reports
Header graphic for February Jobs Report.

March 1, 2024

February 2024 Jobs Report: Above expectations, but there’s more to the story
Hiring Labor Market Reports
January Jobs Report. Featured image for the LaborIQ article January 2024 Jobs Report: January jobs on fire.

February 2, 2024

January 2024 Jobs Report: January jobs on fire

Hiring Labor Market Reports
December Jobs report. Featured image for the LaborIQ article December 2023 Jobs Report: Strong start to 2024.

January 5, 2024

December 2023 Jobs Report: Strong start to 2024

Hiring Labor Market Reports
Header graphic for November Jobs Report.

December 8, 2023

November 2023 Jobs Report: November’s 199K job gains misleading for most businesses

Hiring Labor Market Reports
Header graphic for October Jobs Report.

November 3, 2023

Hiring Cools in October

Hiring Labor Market Reports
Featured image for the LaborIQ article Hiring Accelerates in September.

October 6, 2023

Hiring Accelerates in September

Hiring Labor Market Reports
Featured image for the LaborIQ article Hiring Accelerates in September.

September 1, 2023

U.S. Job Growth Continues to Cool

Hiring Labor Market Reports
National Labor Market Report July.

August 4, 2023

Job Growth Has Normalized and That’s Okay

Hiring Labor Market Reports
National Labor Market Report June.

July 7, 2023

Economy Added a Solid 209,000 Jobs in June

Hiring Labor Market Reports
Hottest and coldest job markets hiring job growth December.

June 15, 2023

Job Growth Momentum Across Industries

Labor Market Reports
Featured image for the LaborIQ article Businesses Are Hiring: Robust Job Gains in May.

June 2, 2023

Businesses Are Hiring: Robust Job Gains in May

Hiring Labor Market Reports
National Labor Market Report April.

May 5, 2023

Despite Layoffs, Unemployment Is Lowest in 50 Years

Labor Market Reports
Featured image for the LaborIQ article More than 1 Million Jobs Added in 2023.
April 7, 2023

More than 1 Million Jobs Added in 2023
Featured Labor Market Reports
Four trees shaped like gears in a field, progressing from bare red branches to full green leaf.
April 5, 2023

How Slow-Recovery Industries Are Reviving Since the Pandemic

Labor Market Reports
A large red percent symbol resting on paperwork next to a calculator on a wooden desk.

March 24, 2023

Why Businesses are Feeling the Pinch of Higher Interest Rates

Labor Market Reports
Featured image for the LaborIQ article Labor Market Momentum Continued in February with 311,000 Added Jobs.

March 10, 2023

Labor Market Momentum Continued in February with 311,000 Added Jobs

Hiring Labor Market Reports
Wooden blocks spelling inflation, stacked with red arrows pointing upward.

March 8, 2023

Inflation: What Does It Mean for the Job Market?

Featured Labor Market Reports
Rows of blue human figures behind a rising red arrow and the words Labor Market Trends.

March 6, 2023

Labor Market Trends in 2023

Labor Market Reports
Head Scratching. Featured image for the LaborIQ article Head-Scratching Job Gains in January: Labor Market Remains Hot.

February 3, 2023

Head-Scratching Job Gains in January: Labor Market Remains Hot

Labor Market Reports
Whats Happening. Featured image for the LaborIQ article What’s Happening to Remote Work.

January 31, 2023

What’s Happening to Remote Work

Hiring Labor Market Reports
Wage Growth. Featured image for the LaborIQ article Wage Growth Slows to 4.6%.

January 6, 2023

Wage Growth Slows to 4.6%

Labor Market Reports
The Labor Market. Featured image for the LaborIQ article The Labor Market Has Not Gotten the Memo.

December 2, 2022

The Labor Market Has Not Gotten the Memo

Labor Market Reports
A Guide to Supporting Laid Off Employees.

November 23, 2022

A Step-by-Step Guide to the Compensation Planning Process (Clone)

Labor Market Reports
Labor Market. Featured image for the LaborIQ article Labor Market Rolling Strong with 261,000 Jobs Added in October.

November 4, 2022

Labor Market Rolling Strong with 261,000 Jobs Added in October

Labor Market Reports
Featured image for the LaborIQ article Inflation: How It Impacts Working Parents and Child Care Costs.

September 19, 2022

Inflation: How It Impacts Working Parents and Child Care Costs

Compensation Labor Market Reports
The Return To. Featured image for the LaborIQ article The Return To Office: Impact on Turnover and Compensation Demands.

September 12, 2022

The Return To Office: Impact on Turnover and Compensation Demands

Labor Market Reports
Interest Rates. Featured image for the LaborIQ article Interest Rates Hike Again: Consumer Demand at Stake.

June 27, 2022

Interest Rates Hike Again: Consumer Demand at Stake

Labor Market Reports
Featured image for the LaborIQ article The Details about New Jersey’s Pay Transparency Law.

June 22, 2022

Workplace Communication Across Generations

Labor Market Reports
Woman Discussing Employee Merit Cycles

October 7, 2021

5 Essential Job Market Indicators That Impact Hiring

Labor Market Reports